In a book called Atlas of the World with Geophysical Boundaries, scientist Athelstan Spilhaus published a series of world maps that emphasized the Earth’s oceans over the continents. The maps turn our familiar continental view of the world inside out. Check out this rendering of one of Spilhaus’ maps by Le Cartographe:
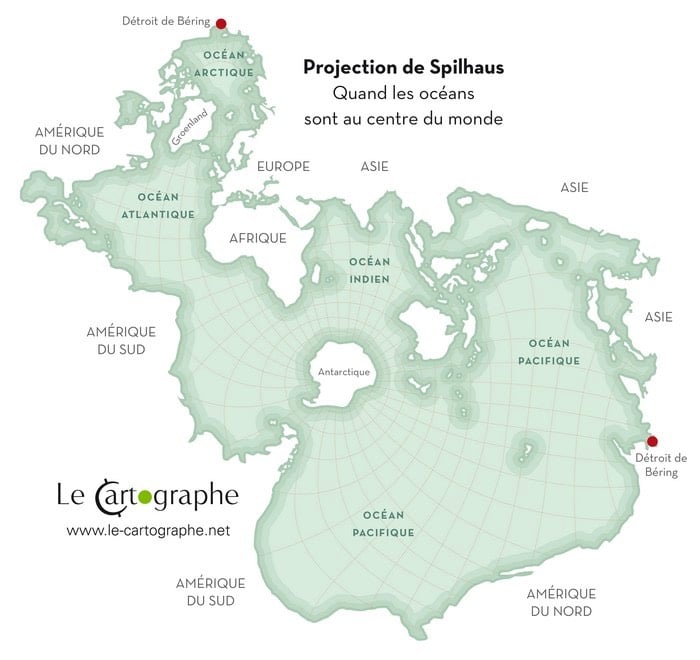
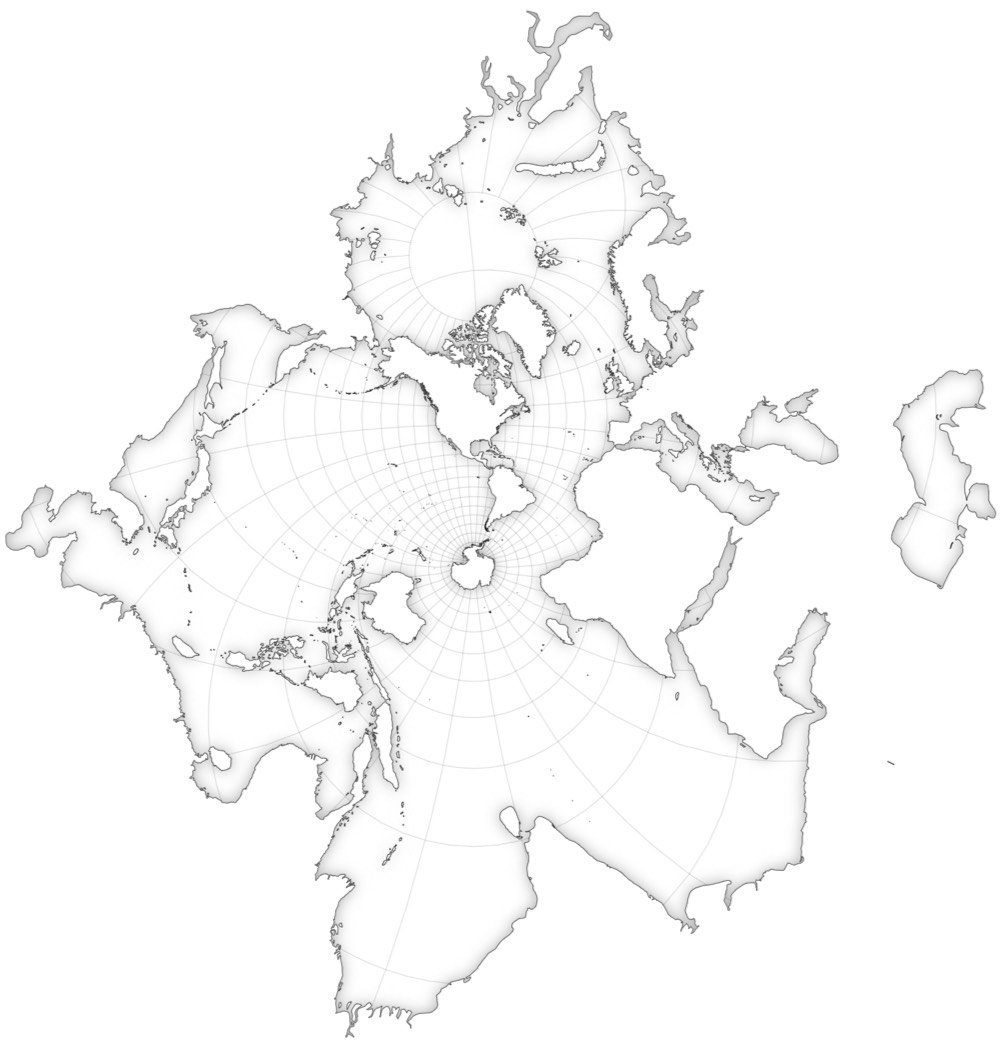
Takes a second to get your bearings on that, right? One big ocean with Antarctica in the middle, surrounded by the stretched-out landmasses of Asia and the Americas. Jason Davies recreated some of the other Spilhaus maps and so did Mike Bostock.
You can see a bunch of Spilhaus’ other shoreline maps by flipping through the pages of his book on Google Books.
In an adaptation of a talk he gave at the recent Eyeo Festival, Mike Bostock talks about visualizing algorithms.
Algorithms are a fascinating use case for visualization. To visualize an algorithm, we don’t merely fit data to a chart; there is no primary dataset. Instead there are logical rules that describe behavior. This may be why algorithm visualizations are so unusual, as designers experiment with novel forms to better communicate. This is reason enough to study them.
But algorithms are also a reminder that visualization is more than a tool for finding patterns in data. Visualization leverages the human visual system to augment human intellect: we can use it to better understand these important abstract processes, and perhaps other things, too.
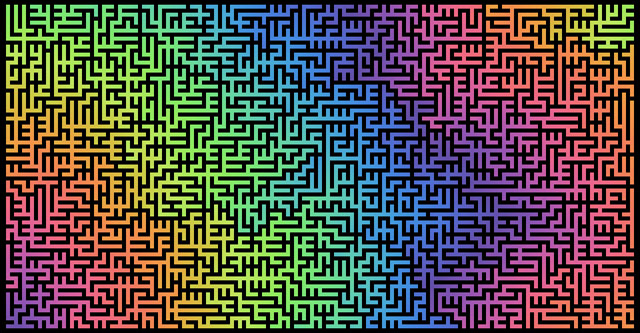
If nothing else, skim through the text and play the visualizations. The one of the maze turning into a tree visualization baked my noodle a little bit.
Stay Connected